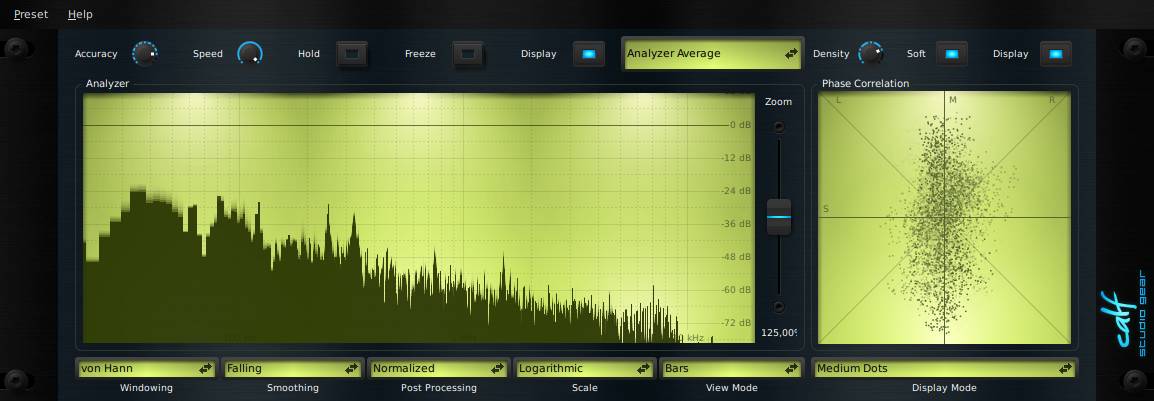
Analyzer

Functionality
An Analyzer inspects the audio signal and displays various graphs to give an impression of the structure of a sound. It is able to draw a frequency response graph with adjustable accuracy and some other features as well as a phase correlation meter (goniometer). The frequency response shows how much energy a signal has over the frequency range. The goniometer gives an impression of the stereo behavior of your track.
Tips
The goniometer shows mono and stereo allocation of your audio signal. A signal mostly vertical around the center shows a high mono ratio while a signal with a wide spread from left to right displays a signal with a high amount of stereo (phase shift) signal. A signal only audible on the right speaker will produce a line from south west to north east and vice versa. The Calf Goniometer will adapt to the amount of the incoming audio signal by zooming in or out automatically.
Controls
- Accuracy: The amount of visible frequencies. It also raises the time, in which audio samples are collected to calculate the frequency response. The higher Accuracy is set, the less responsive to short attacks the graph is.
- Speed: How often a FFT is calculated and displayed.
- Hold: Draw a maximum peak graph above the output graph.
- Freeze: Freeze the graph in the actual state. An eventually displayed peak hold will continue in being pushed to the limit.
- Display: Stop displaying this widget.
- Mode: Select the analyzers working mode and sources.
- Zoom: Changes the zoom for the displayed frequency response. In mode "Stereo Image" it effects the offset above which values will be displayed.
- Windowing: Select a window to be used to weight the incoming samples.
- Smoothing: Select a method to smooth the transition from one FFT to the next.
- Post Processing: Select a calculation, which will be done after the FFT is done. Due to the logarithmic frequency scale, not every value in the FFT can be shown in the graph. The higher the frequency, the more values are left out. Here you can decide what to do with those.
- Normalized will leave out the values between points on your monitor and instead normalize the values shown.
- Average will calculate the average of the not-shown values and display it.
- Additive will sum up the left-out values.
- Denoised Peaks will try to filter out noise in the FFT to leave blank peaks. This does not represent the actual music signal but can help to detect an important frequency.
- Scale: Select if a linear or logarithmic scale is used for the shown values. The latter works well with View Mode Bars.
- View Mode: Select if bars or lines are drawn.
- Dots: The amount of dots shown on the canvas.
- Fade: Choose if a fade out effect should be drawn (doesn't raise the overall CPU consumption).